Assessment of CALMET Performance Using In-Situ Data in a Complex Meteorological Environment
Recent, winter-season high ozone concentrations in the Upper Green River Basin (UGRB) led to the Upper Green River Winter Ozone Study (UGWOS) during late-winter 2008, sponsored by the Wyoming Department of Environmental Quality (WYDEQ). Under the right seasonal conditions, the UGRB’s unique natural and anthropogenic factors make rapid winter-time ozone formation possible. Recent development of oil and gas fields Basin-wide has increased the amount of ozone precursors (VOC and NOx) within the airshed. The Basin itself has surrounding mountain ranges that block airflow from entering or exiting during certain synoptic conditions, such as anomalously low wind speeds associated with strong high pressure systems. Finally, snow cover increases the available radiation for photochemistry as well as the atmospheric stability of the Basin.
Given the known-importance of meteorology during these events, the UGWOS field study produced a comprehensive, Basin-wide meteorological database during the 2008 high ozone events. The resulting, quality-controlled meteorological database contains high resolution observations during intensive operation periods as well as hourly observations. Hourly observations include: a 19-station surface-based mesonet and a multi-level SODAR. High resolution measurements of vertical wind data and temperature from rawinsondes are also available during the intensive operation periods.
Nearly the entire UGWOS database was integrated into the CALMET wind field development for a 7-day period in February 2008, using a 1-km resolution to assess the extent of atmospheric conditions associated with ozone formation. The CALMET simulations blended three-dimensional hourly RUC analysis fields, observational data and 1-km resolution snow cover data retrieved from the National Hydrologic Remote Sensing Center. Use of accurate snow cover data allowed CALMET to better simulate/replicate the observed mixing heights and vertical temperature profiles, both of which are very important in characterizing the observed meteorological conditions associated with winter ozone formation. This paper will discuss the development of the CALMET database and results of the CALMET model performance in terms of simulating observed meteorological conditions in a complex terrain environment, while employing enhanced geophysical inputs and a high resolution meteorological dataset.
INTRODUCTION
The UGRB, which is located in Sublette County, is bounded by the Wind River Range to the east, the Wyoming Range to the west, the Gros Ventre Range to the north, and bounded by the Uinta Range to the south. These surrounding, significant terrain features effectively create a bowl-like basin that greatly influences the local meteorology relative to the rest of the area. The UGRB is roughly 1,000 meters to 2,000 meters lower than the terrain features to the east and west[1]. Within the UGRB, significant development of oil and gas fields has occurred recently. This development has resulted in the release of significant quantities of NOx and VOC emissions, which are both known ozone precursors. Recent monitoring data has indicated elevated ozone concentrations in the late winter that exceed the National Ambient Air Quality Standards (NAAQS) for 8-hour ozone. As a result of these high concentrations, the WYDEQ initiated the Upper Green River Winter Ozone Study (UGWOS) to understand and characterize observed phenomenon.
The 2008 UGWOS final report[2] documents the monitoring network and field operations during Intensive Operating Periods (IOPs) that were part of the study during February and March, 2008. The UGWOS field study produced a high quality database of observations for several meteorological parameters, both during IOPs as well as regular, hourly observations during February and March 2008. Regular hourly observations from the dense network of surface stations provided surface measurements of wind speed, wind direction, temperature and precipitation. A multi-level SODAR also provided hourly measurements of wind speed, wind direction and an estimate of mixing heights. The regular, hourly observations obtained during the field study are also supplemented with high resolution measurements of the wind speed, wind direction and temperature profiles during the IOPs. In the formulation of the CALMET database[3], these observations were blended with the hourly analysis fields from the 20-km Rapid Update Cycle (RUC) numerical weather prediction model and other regional surface and upper air data sites.
Other model inputs included the USGS 1:250,000-scale Digital Elevation Model (DEM) dataset with a horizontal resolution of 3 arc-seconds (approximately 90 meters); the Composite Theme Grid (CTG) dataset for land use and land cover data; and daily National Operational Hydrologic Remote Sensing Center snow depth data. The inclusion of specific snow depth data into the CALMET simulation was an important detail that was necessary to accurately reproduce mixing heights observed at the SODAR site; the snow cover data will be discussed in more detail later. Further assessment of available meteorological data allowed for a robust analysis of model input and model output over the modeling domain (spatially) and modeling period (temporally). The development and assessment of the CALMET database will be discussed more thoroughly herein.
METEOROLOGICAL CHARACTERISTICS OF WINTER OZONE IN THE UGRB
Given the atypical occurrence of high concentrations of ozone forming during a cold season in an area with little urbanization, extensive research of the recent winter ozone events was undertaken by WYDEQ. Based on this research, several common factors were identified during the late winter high ozone events. These factors include:
- continuous emissions of VOC and NOx from oil and gas field sources,
- extensive snow cover,
- sunlight,
- low wind speeds,
- wind reversals (pollutant recirculation), and
- stable atmosphere with strong temperature inversions1.
These meteorological factors were generally the result of a synoptic-scale high pressure system controlling regional weather. As the high pressure system centered over the UGRB, wind speed and mechanical turbulence were reduced. At the same time, snow cover and low wind speeds allowed the Basin atmosphere to cool rapidly and create strong temperature inversions, which persist due to the low wind speeds and quiescent weather. Finally, the increased albedo from the snow cover increased the upward radiation flux for photochemical reactions.
The importance and sequence of the above factors is confirmed by the success of the forecasting methodology utilized by WYDEQ when planning for IOPs. Prior field campaigns successfully predicted high ozone events, and as a result, additional instrumentation/monitoring equipment were in place for the IOPs to monitor the antecedent meteorological conditions leading up to and during the 2008 winter high ozone events and successful IOPs over the two month period2.
CALMET DIAGNOSTIC MODEL SETUP
Proper characterization of the meteorological conditions associated with this complex environment was necessary to assess the spatial extent of the above-described meteorological conditions. The regulatory version of the CALMET diagnostic meteorological model (version 5.8, level 070623) was used to integrate observational and RUC analysis data into a high resolution 3-D wind field. The CALMET model uses high resolution terrain and land use data to diagnostically adjust boundary layer parameters and kinematic effects across the domain, as appropriate[4].
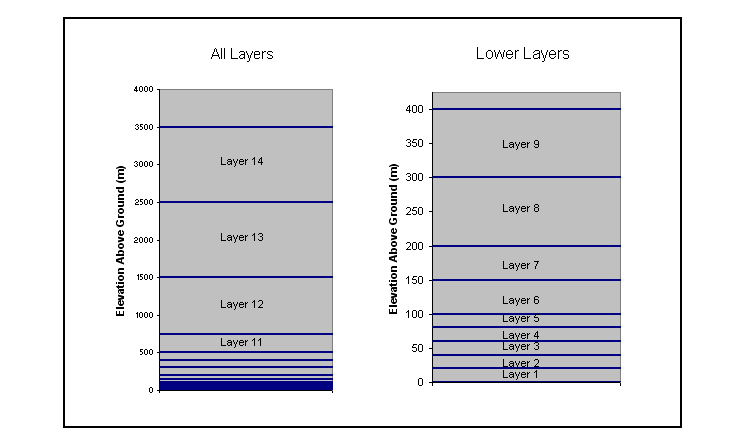
Figure 1 shows a plot of the CALMET computational domain while Figure 2 shows the structure of the vertical layers used in the simulations. In order to capture pertinent transport and edge effects relative to the UGRB, the CALMET domain extends into northwestern Colorado, northeast Utah and southeast Idaho. The CALMET domain is defined by 464 x 400 1-km grid cells in the horizontal direction and 14 vertical layers (surface to 3500 meters at the top). The vertical layers in the CALMET simulation were selected based on observations of mixing heights in the UGRB to help better define the mixing height during high ozone events.
Figure 1. Plot Of The CALMET Modeling Domain With Terrain:
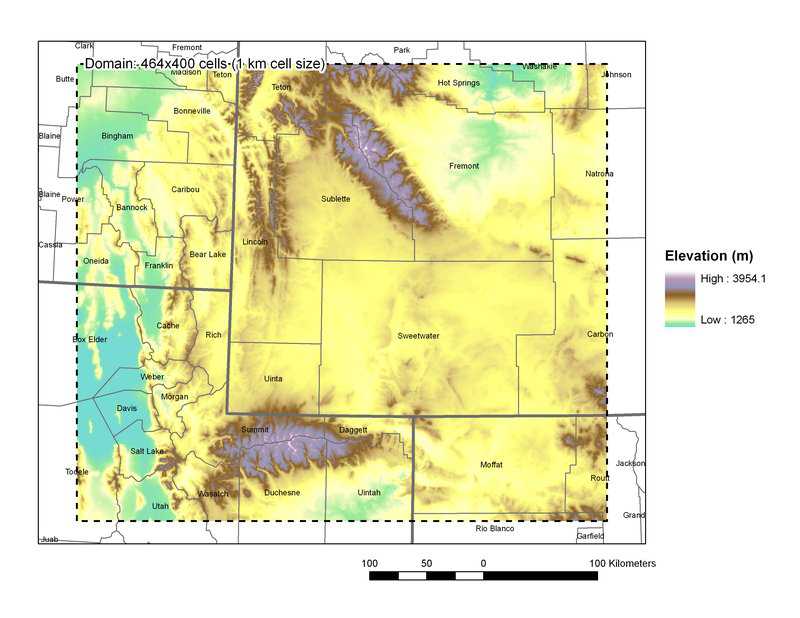
Figure 2. Plot Of The CALMET Vertical Layers Used In The Simulations:
The National Center for Environmental Prediction (NCEP) 20-km resolution Rapid Update Cycle (RUC) hourly analysis fields were used as the initial guess field and later blended with surface observations from 19 mesonet sites to produce a final CALMET database. The 19 mesonet sides provided, at a minimum, local-scale wind speed and wind direction; some monitoring sites also recorded relative humidity, temperature and air pressure. Cloud cover from the National Weather Service (NWS) site at Big Piney, Wyoming was also used. Figure 3 shows a plot of the meteorological monitoring stations within and around the UGRB used in the analysis.
Figure 3. Plot Of Surface And Upper Air Meteorological Stations:
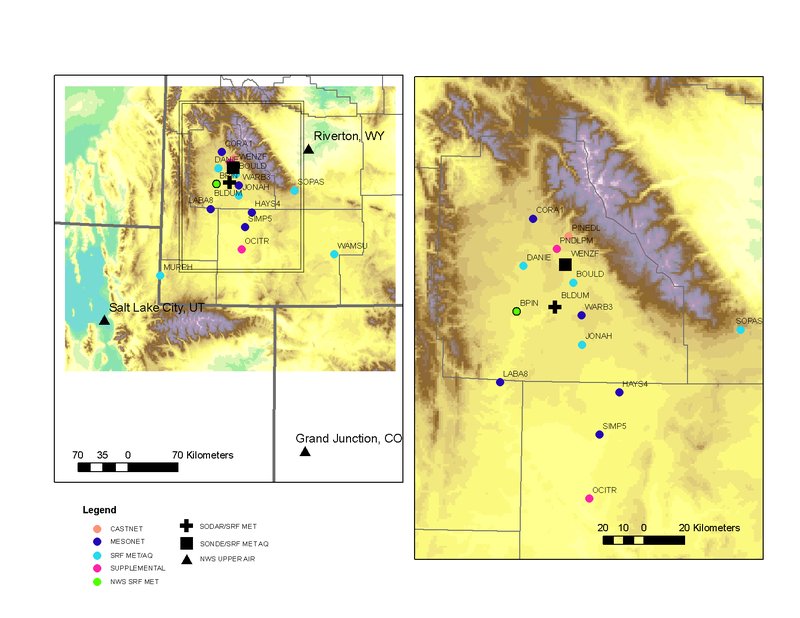
In addition to the RUC data, the aloft meteorological data was based on the hourly SODAR wind data (valid up to 250 meters) and the sonde releases during the IOPs. As each site is within the UGRB, excellent spatial resolution is provided throughout the area; however, both of these upper air datasets also have limitations when implemented in CALMET. The SODAR does not measure temperature, thus temperature data from the RUC grid cell that is nearest to the SODAR site was used to supply the temperature data for this upper air file (UP.DAT). The sonde data provided excellent resolution of all measured parameters, but the balloon/sonde releases were often spaced farther apart in time than what is required by CALMET (more than 14 hours). In order to fulfill the time requirement, a pseudo-sounding from the closest RUC grid cell was used to fill the time gaps, when appropriate. Additional regional upper air sites were also included in the analysis, such as Riverton, Wyoming and Salt Lake City, Utah.
To the extent possible, all data collected during the IOPs were either used in the CALMET model simulations or used as validation in the CALMET model performance evaluation. The estimated mixing height data from the SODAR could not be used as explicit model input; therefore, it was used to validate the CALMET-predicted mixing heights. It was this validation/analysis that highlighted the need to replicate the boundary layer energy budget associated with the influence of snow cover, which is inherently contained within the observations. Another analysis compared the sonde vertical temperature data and the RUC vertical temperature data at the sonde grid cell for the same time periods. Since this comparison of independent datasets demonstrated that the RUC temperature data exhibited very good agreement with the sonde data, the RUC temperature data was used as the source of temperature data for the analysis (ITPROG). These analyses will be discussed in more detail below.
The CALMET model was run with default regulatory settings (MREG=1) and default settings, except for the switch settings discussed below. The project specific settings such as TERRAD, radius of influence values (R-values), etc. were based on domain topography (specifically within the UGRB) and station density, respectively. All model switch settings were qualitatively assessed via graphical analyses to determine the most representative values for TERRAD and the terrain weighting influence parameters. The final non-default switch settings used in the CALMET wind field simulations are as follows:
- TERRAD = 15 km (representative length scale for terrain feature in and around the UGRB),
- R1, R2 = 4 km (limits station influence in complex meteorology and interference with surrounding mesonet sites),
- R1MAX, R2MAX = 20 km (limits station influence in complex meteorology and interference with surrounding mesonet sites),
- ITPROG = 2 (temperature fields based on prognostic data)
- MNMDAV = 5 grid cells (the default is 1 grid cell).
The MNMDAV parameter controls the smoothing of the mixing height field. As a mixing height is calculated for each grid cell, the default value resulted in a noisy mixing height field due to the complex terrain in and around the UGRB. Through sensitivity analyses, a value of 5 was found to retain important features while reducing rapid cell-to-cell variations. The ITPROG setting will be discussed in more detail below.
GEOPHYSICAL PROCESSING AND ENHANCEMENTS
The geophysical data used in the CALMET simulations consisted of United States Geologic Survey (USGS) 90 meter resolution DEM data. The land use data from the USGS Composite Theme Grid (CTG) database, at a minimum resolution of 200 meters, were used to produce a gridded field of the dominant land use categories within each grid cell.
Snow is an important component of the land/air interface that greatly affects the surface energy budget within the boundary layer. When snow is present, much of the solar insolation (short-wave UV energy) is reflected back to the atmosphere, negating potential heating and resultant mixing near the ground. Conversely, when snow is not present (as in the standard land cover data), much of the short-wave solar insolation energy is absorbed by the ground surfaces and reradiated as long-wave (infra-red) energy. As a result, much less of the incoming solar insolation flux is reflected (because of the lack of snow cover), and is instead absorbed by the ground surfaces, thereby heating the ground surfaces, and initiating convective and mechanical mixing of air near the surface and within the boundary layer, allowing mixing heights to grow throughout the day.
This effect was confirmed through the initial CALMET simulations, which did not explicitly include snow cover by default. These CALMET simulations produced mixing heights which grew as a function of daytime heating, i.e., continuously increasing heights throughout the afternoon to over 500 meters. This is in direct contrast to the SODAR estimated mixing heights, which revealed much lower mixing height values. As a sensitivity analysis, the entire domain was (through remapping GEO.DAT geophysical parameters) modeled as if covered completely by snow. Figure 4 shows a time series plot of mixing heights on February 20, 2008 from the CALMET simulation without snow cover and the CALMET simulation assuming the domain is completely covered with snow compared to the SODAR estimated mixing heights. As shown in Figure 5, the CALMET simulations with snow cover produced mixing heights that were much more in line with those observed at the SODAR, (e.g., 250 meters or less). Thus, the refinement of the geophysical data to reflect the actual amount of snow cover during the IOPs, rather than all-snow or no-snow, was considered to be an important value-added step and undertaken.
Figure 4. Time Series Plot Of February 20, 2008 CALMET Predicted Mixing Heights With And Without Snow Cover Compare To The Sonde Estimated Mixing Heights:
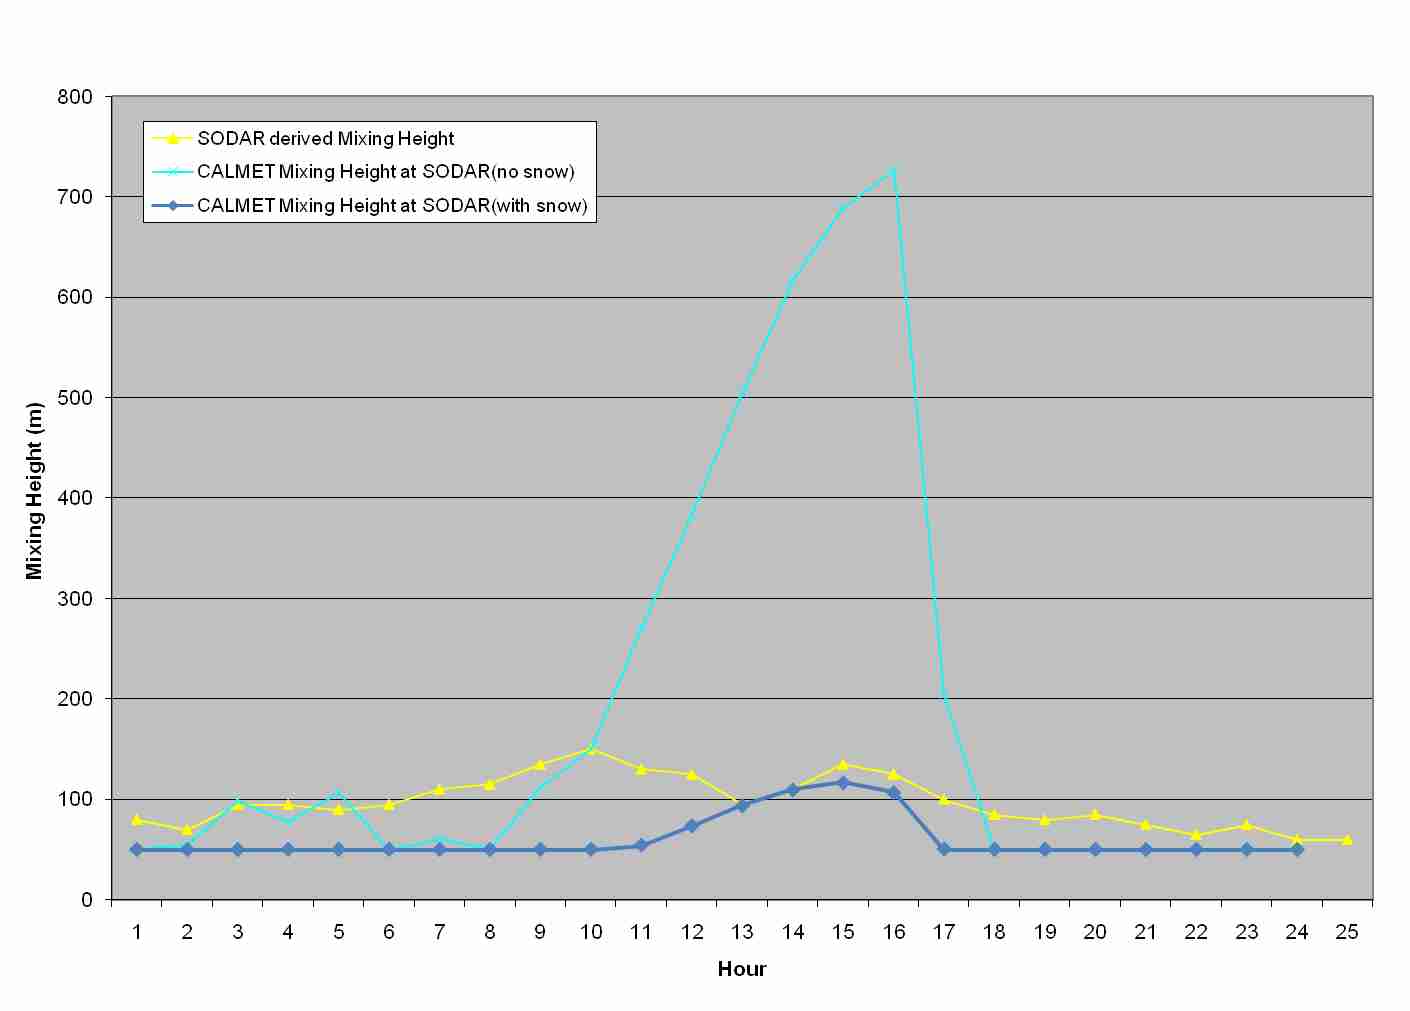
Figure 5. Plot Of The Albedo Within The CALMET Modeling Domain Compared To Snow Depth Over The Central Rockies Region. Snow Depth Plot From The National Hydrologic And Remote Sensing Center:
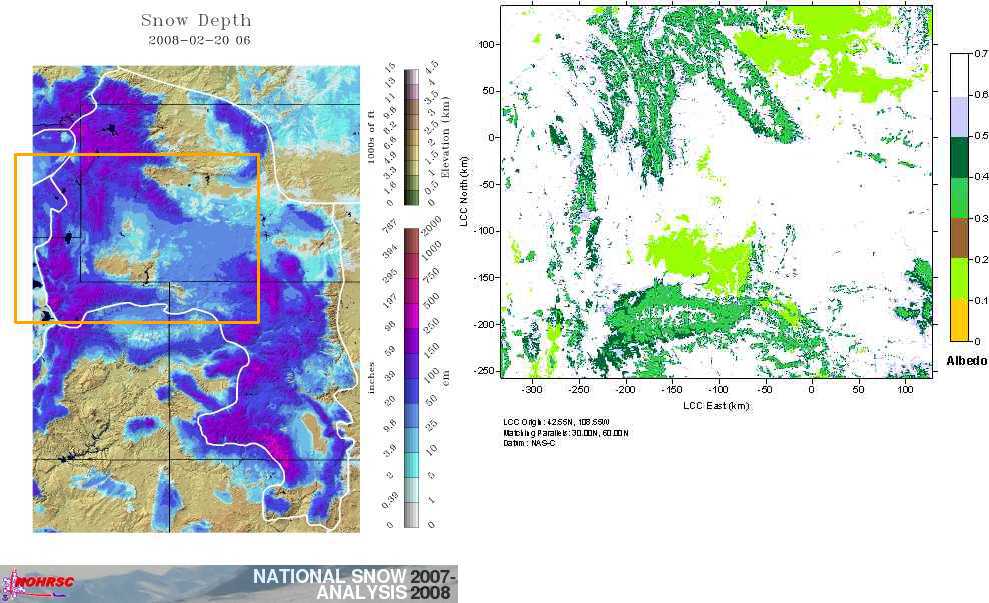
Using daily snow cover data at a 1 km resolution from the National Operational Hydrologic Remote Sensing Center, each CALMET grid cell in the surface layer (Layer 1) were assessed to determine if they were covered by snow according to the National Operational Hydrologic Remote Sensing Center database. If the grid cells were determined to have sufficient snow cover (greater than 50 % of the grid cell is covered by snow), the geophysical parameters such as albedo, Bowen ratio and surface roughness were modified to values recommended by the AERSURFACE manual for each snow covered land use type. Some exceptions to this approach were made in areas where there was barren ground or low vegetation land use. For these land use types, the surface albedo for perennial snow and ice were used. If grid cells were determined to have less than 50% snow cover, the geophysical parameters were modified to values recommended by the AERSURFACE manual for each non-snow covered land use type (late fall). The resulting geophysical database better represents those land surface conditions that actually occurred within the UGRB during IOPs. Figure 5 shows a plot of albedo within the CALMET modeling domain compared with a snow depth map from National Operational Hydrologic Remote Sensing Center for February 20, 2008. Thus when snow cover is included in the land use processing for CALMET (GEO.DAT), more accurate and realistic land surface properties are provided to CALMET which should help improve the CALMET predictions of mixing heights, temperature structure and atmospheric stability.
The determination of snow cover was evaluated on a daily basis. In order to be compatible with CALMET version 5.8, a separate snow cover-enhanced GEO.DAT file was created for each day of the modeling period rather than creating a time-varying geophysical file. The CALMET model was, in turn, run individually for each day of that period.
CALMET VERIFICATION
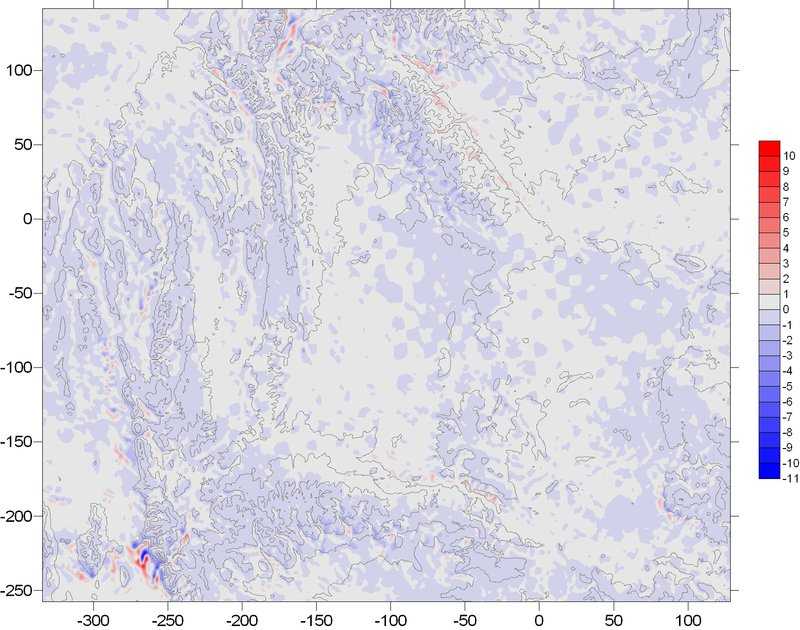
As part of the CALMET database development, a detailed verification of the meteorological data input/output was conducted for several monitoring sites within the UGRB, specifically the ozone monitor and SODAR locations. Through the use of time series and scatter plots, the raw data (input) and the CALMET simulated data (output) were analyzed to confirm interpretation and proper implementation by the CALMET model, (e.g., units, timing issues, diurnal variations, etc). On a domain-wide basis, descriptive performance statistics were generated from PRTMET output for each vertical layer, and for both the raw input data and derived meteorological parameters. Using these data, domain-wide statistics could be rapidly evaluated and plotted for quality-assurance (QA) purposes. This QA step also allowed for further examination of statistical outliers (minimum and maximum values) of the parameters. For example, it was verified that the maximum horizontal wind speeds (~ 40 m/s) occur in the areas of high elevation terrain features, which are at the highest vertical levels within the CALMET domain. Similarly, an analysis of the hour with the maximum and minimum vertical velocity (absolute value ~10 m/s) indicates that maximum vertical velocities occur as an isolated couplet in a small region of the domain, while the remainder of the domain had more typical vertical velocities. This is shown in Figure 6.
Figure 6. Two-Dimensional Plot Of CALMET Vertical Velocities:
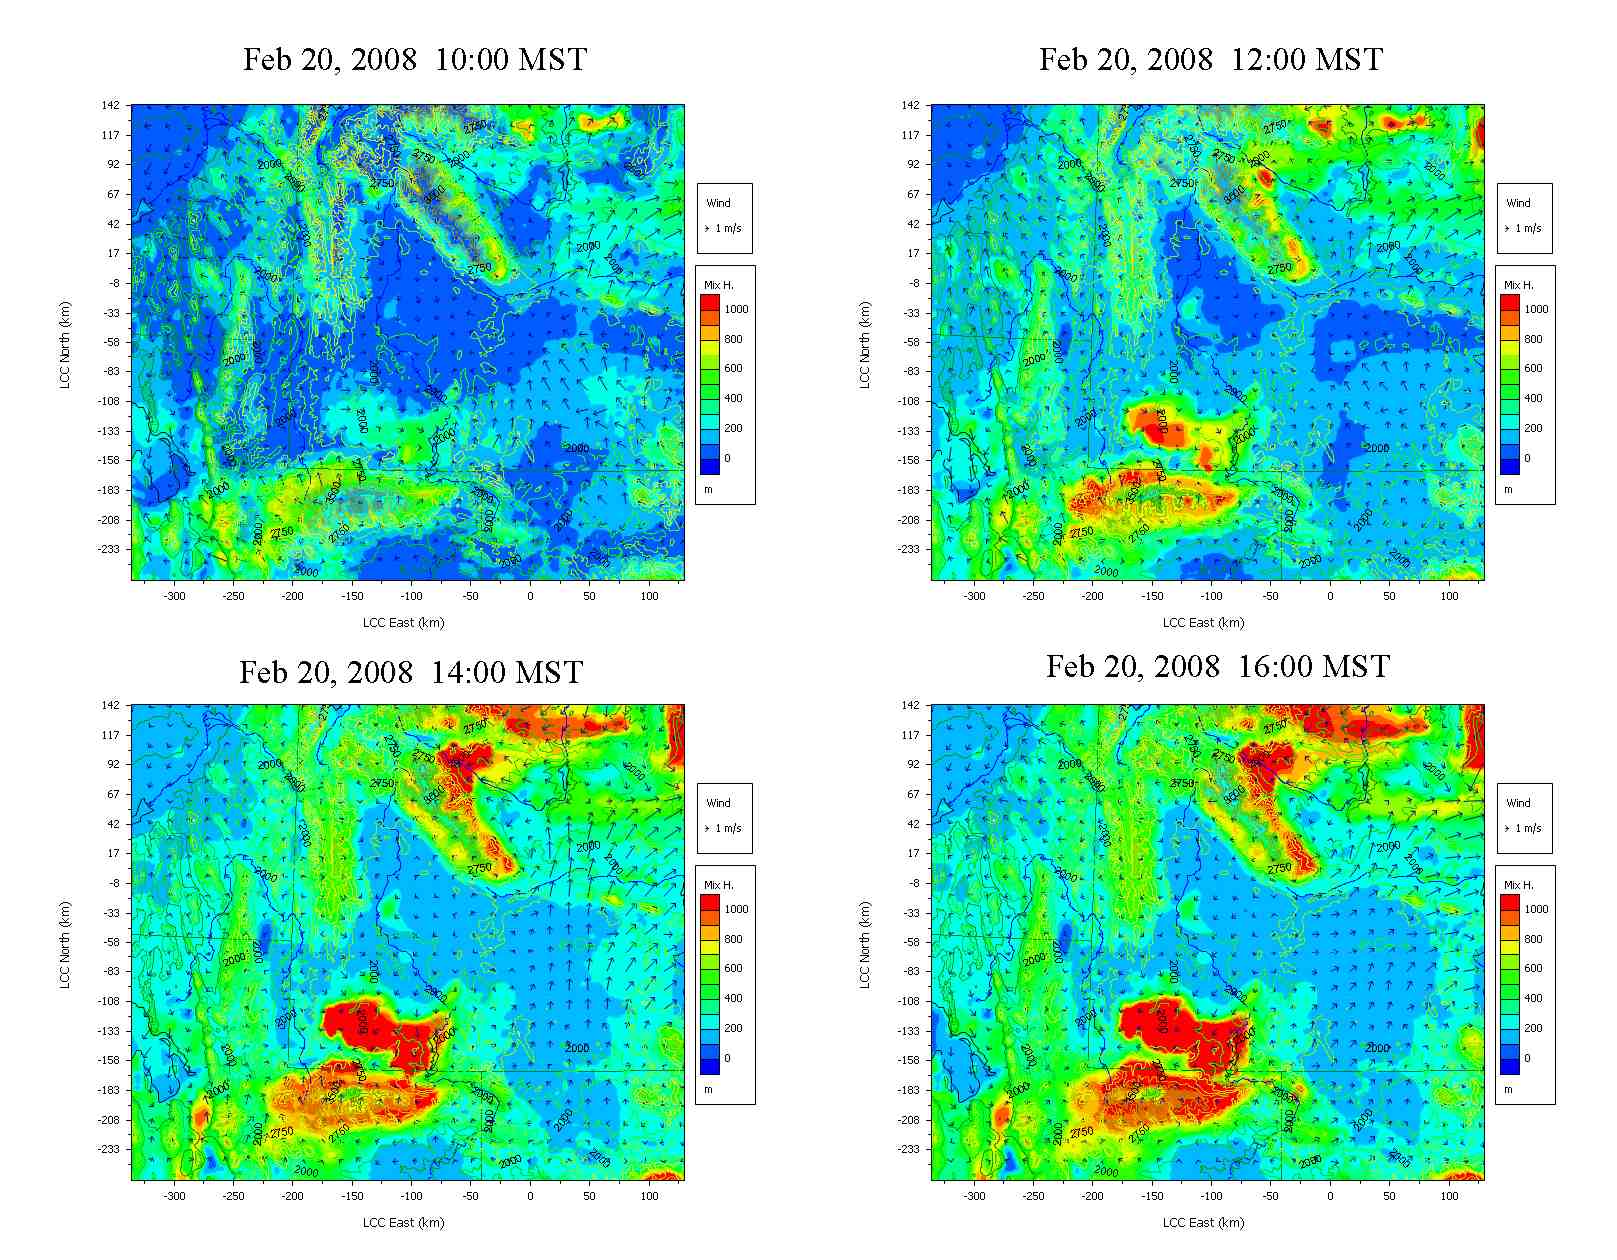
Other QA procedures included two dimensional plots of specific hours or days for pertinent meteorological variables such as mixing height and wind speed. Wind vectors were also plotted during various times and at various vertical layers throughout the period that was analyzed. The plots aided in determination of representative weighting values (TERRAD, R-values) and also assisted in assessing CALMET’s terrain adjustment procedures. Figure 7 shows a set of wind vector plots over the UGRB area at the surface, 350, 1125, and 3000 meters above ground; this plot clearly shows the shallow slope flow on the surface wind field plot and reduced terrain effects with increasing height. Figure 8 shows a more detailed wind vector plot for February 20, 2008 at 0400 LST; this plot clearly shows the downslope flows as well as the terrain blocking effects occurring as the stable flow is deflected around terrain features. Overall, the kinematic terrain effects appropriately extended into the UGRB during times of downslope flows, without undue influence. Figure 9 shows 2-D plots of CALMET predicted mixing heights on February 20, 2008 at 10:00, 12:00, 14:00, and 16:00 Mountain Standard Time. The mixing height plots show the expected diurnal changes in mixing heights. The effect of snow cover is clearly shown with much higher mixing heights occurring over those parts of the modeling domain with bare ground (also see Figure 5).
Figure 7. Plot Of CALMET Predicted Wind Fields At The Surface, 350, 1125, And 3000 Meters Above Ground For February 20, 2008:
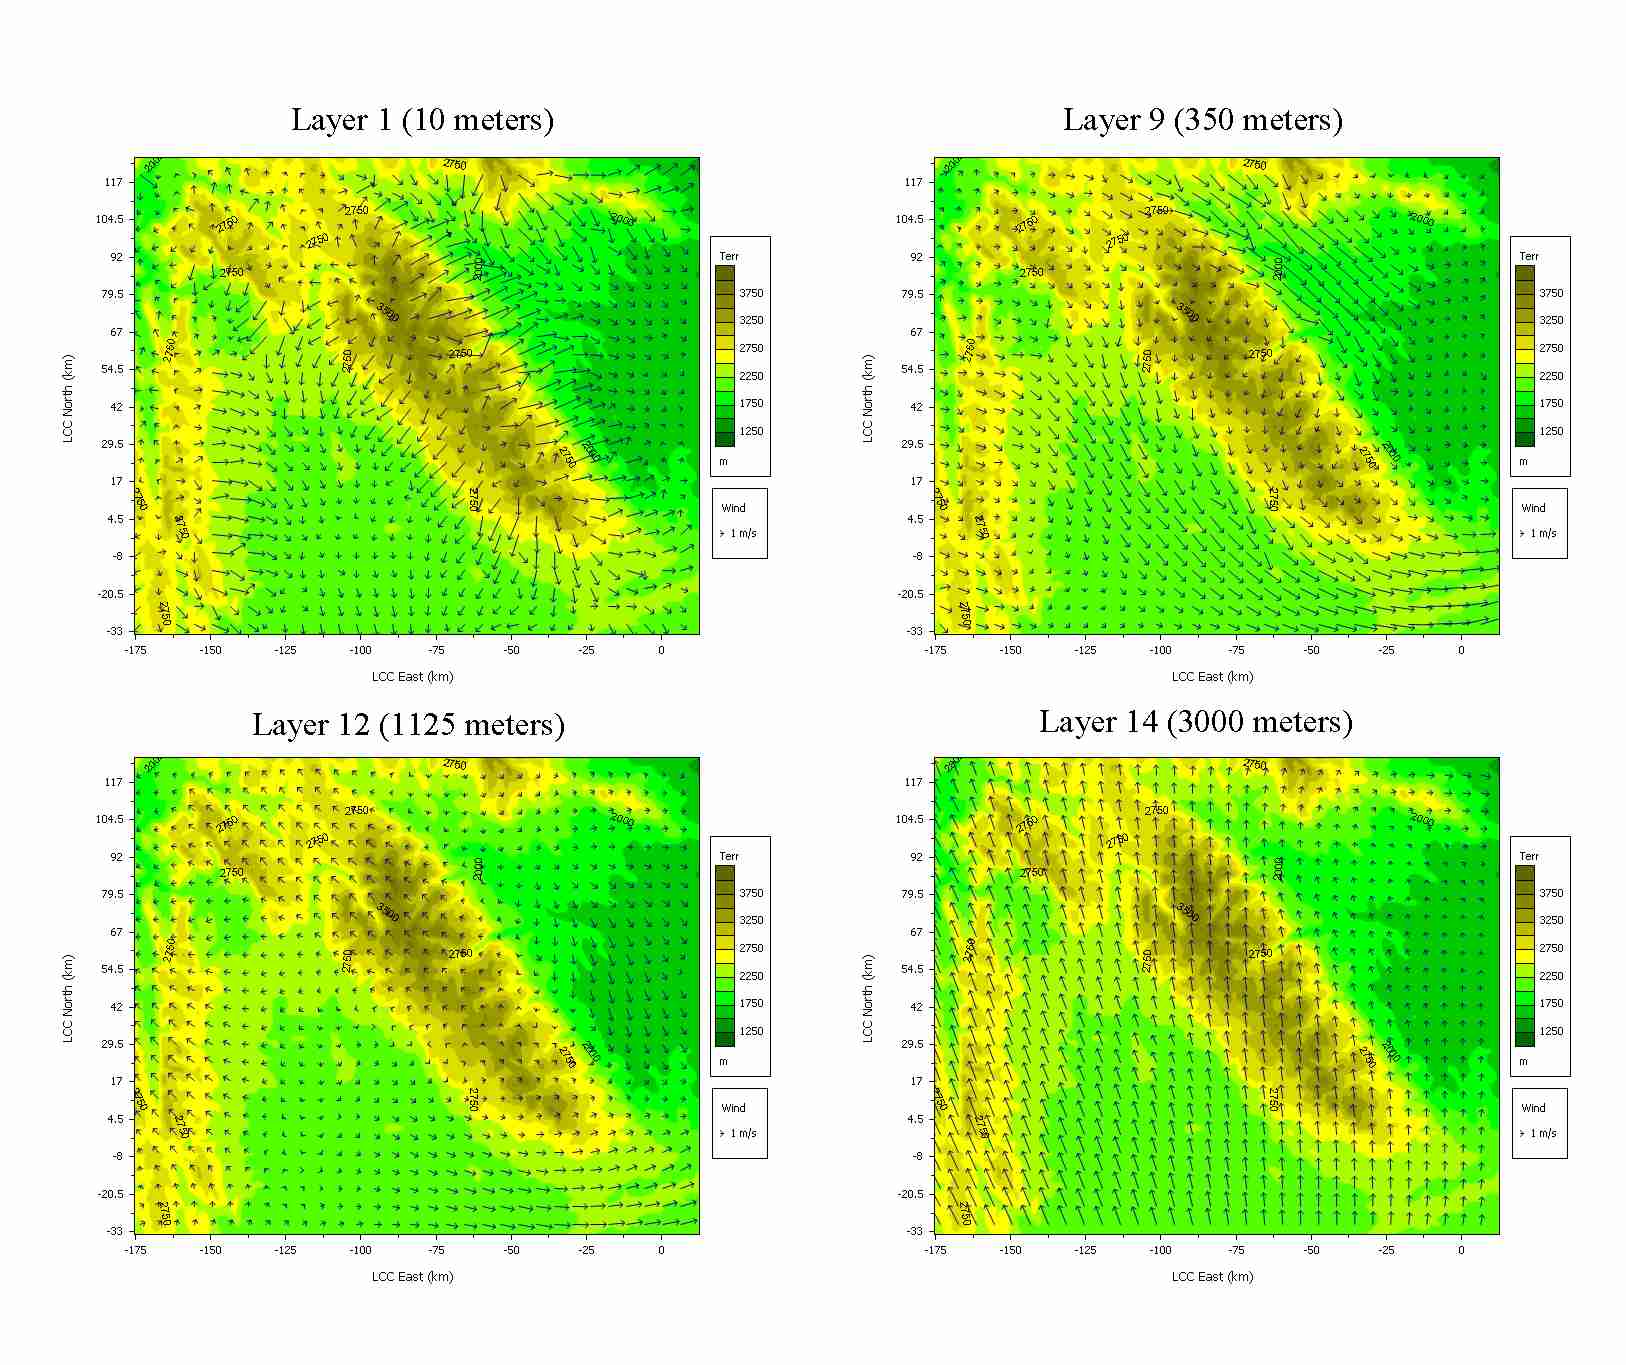
Figure 8. CALMET Predicted Wind Field Plot Over The UGRB On February 20, 2008 At 0400 Local Standard Time:
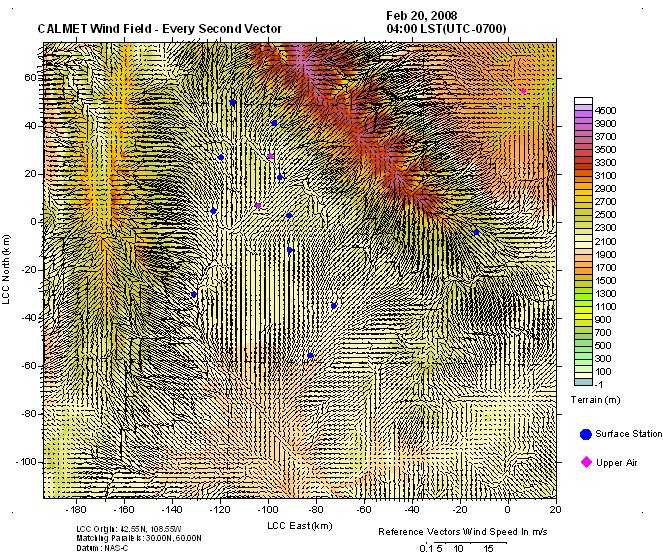
Figure 9. Plots of CALMET predicted mixing heights on February 20, 2008:
In addition to the above QA and as discussed previously, the UGWOS database contained meteorological data that allowed for a robust model validation effort. Of particular importance in the formation of winter ozone are the observed low-level mixing heights, which were estimated from the SODAR. The SODAR emitted and received acoustical impulses periodically. Based on these acoustical signals and the resulting backscattering of acoustic energy received by the SODAR, atmospheric turbulence and the associated mixing height values were inferred by a trained meteorologist. The IOP studies occurred during periods of low mixing heights that persisted throughout the period, despite the abundant sunlight and clear skies present in the area. The strong temperature inversions and low wind speeds created a stable lower atmosphere, which inhibited vertical mixing and limited transport and dispersion of emissions within the UGRB. These conditions were a result of, and were exacerbated by, the extensive snow cover across the UGRB.
The mixing heights estimated by the SODAR were compared to the mixing heights calculated by CALMET. These hourly comparisons were conducted for the entire modeling period and show good agreement in the general magnitude of daily maximums and nightly minimum mixing height values (see Figure 4 for the comparison on February 20, 2008). As previously discussed, the inclusion of snow cover into the CALMET model increased the accuracy of its mixing height predictions.
ANALYSIS OF VERTICAL TEMPERATURE PROFILES
The vertical temperature profile is an important parameter used in the computation of mixing height and kinematic effects. As mentioned above, the availability of detailed sonde data during the IOPs provided a high resolution, in-situ dataset. However, its limited availability (temporally and spatially) reduced its overall usefulness as the primary source of vertical temperature data across the domain. Given the unique topographic setting of the UGRB, the sonde data is not representative of the vertical temperature structure in other regions of the domain outside the UGRB. Since the CALMET data will be used for a variety of purposes, both local scale and regionally, the simulations must not only properly define the temperature field within the basin, but also adequately define the temperature field across the entire modeling domain.
The sonde temperature data was a critical part of the evaluation of the RUC temperature data. The evaluation of the RUC vertical temperature profile was performed through direct comparisons with the sonde vertical temperature profiles and the RUC profiles at the RUC grid cell that is closest to the location of the sonde releases.
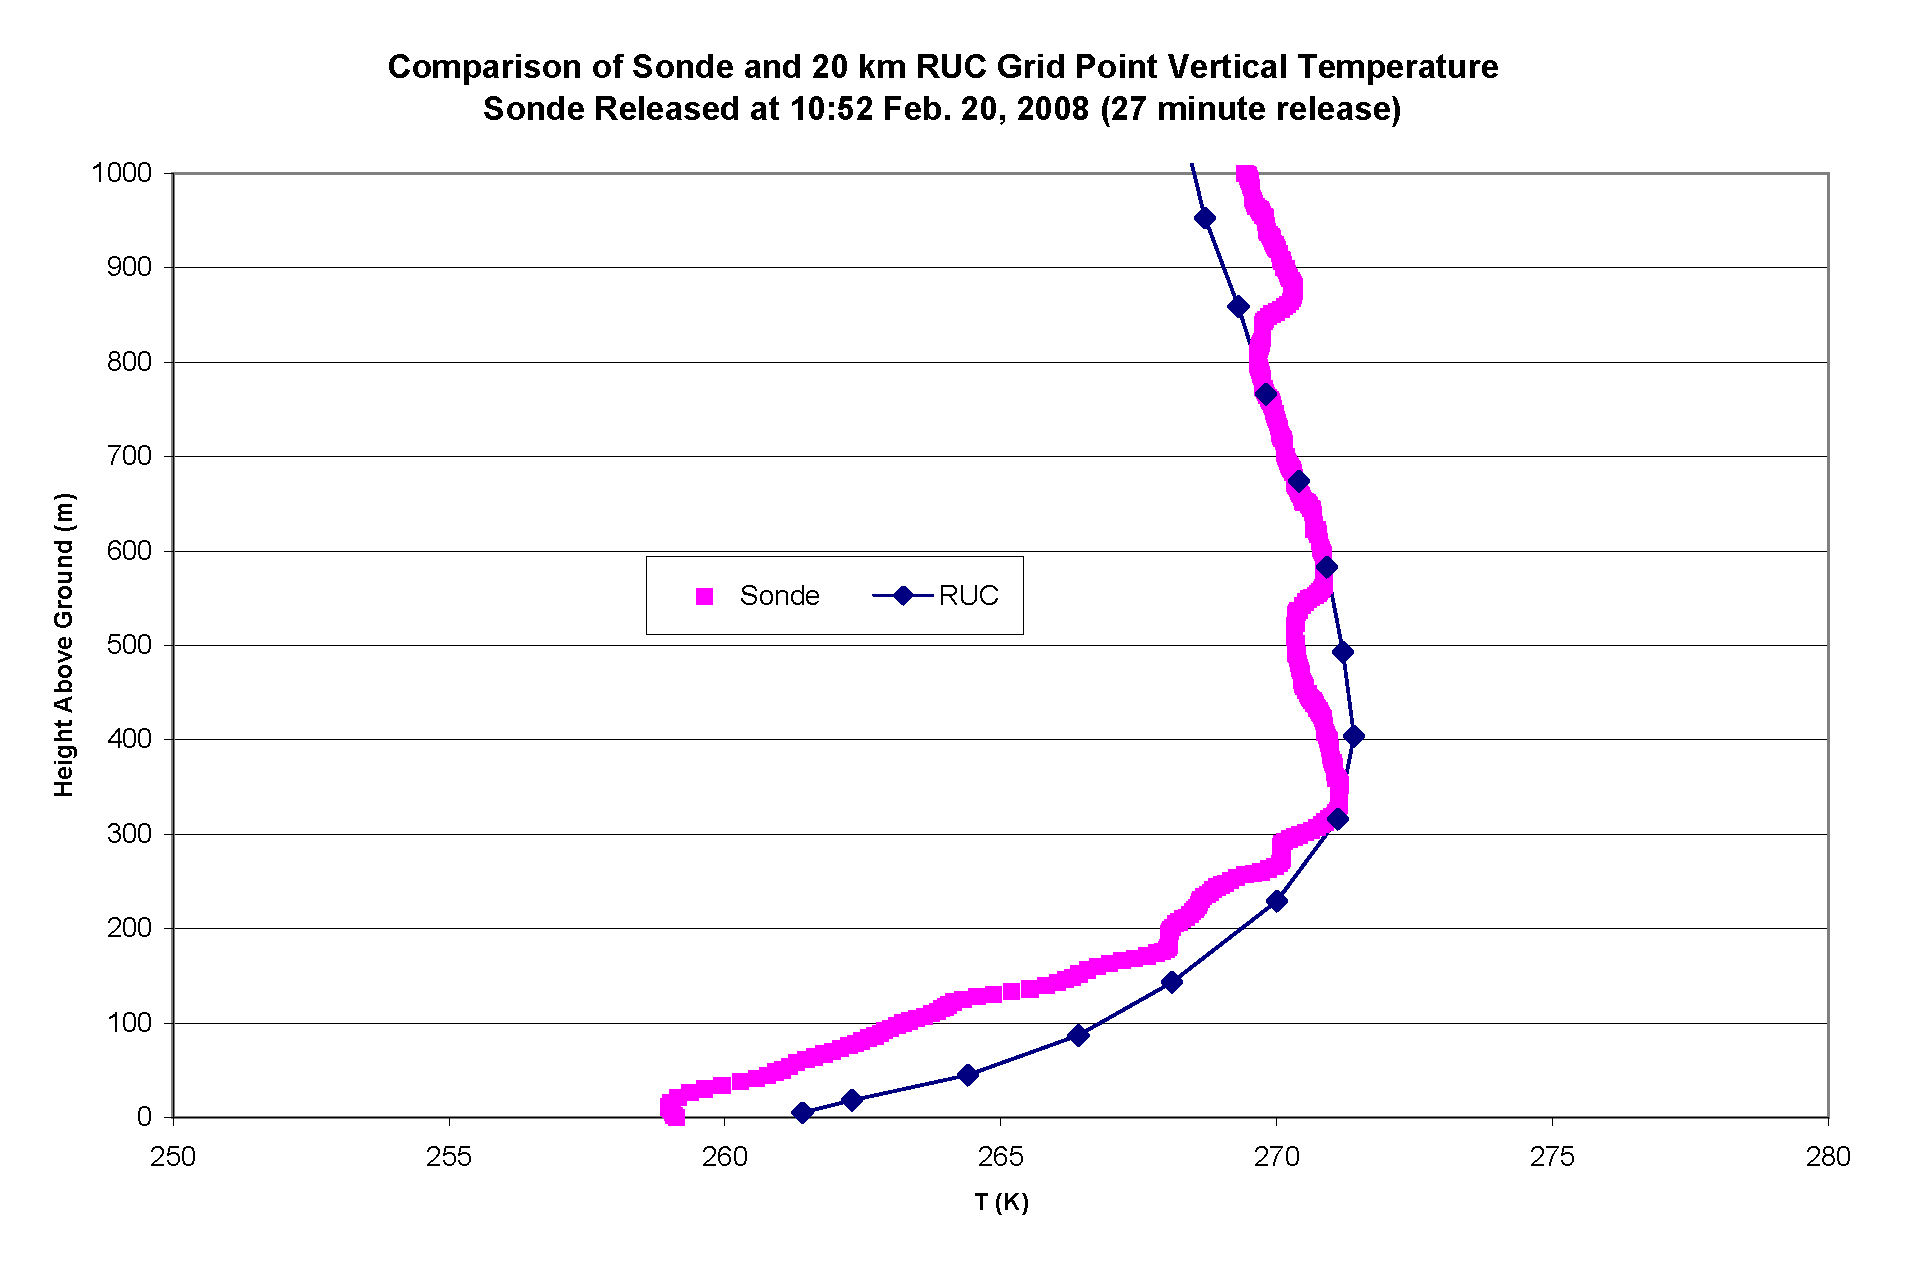
Figure 10 shows a plot of the vertical temperature profile from the sonde measurements and for the nearest RUC grid point. This plot shows very good agreement between the sonde and RUC profiles, which was the case for other times and days as well. Generally, the RUC data performs well in replicating the temperature profile at the SODAR grid point – especially in the morning soundings. In early and late afternoon, the RUC profile mimics the general temperature profile as compared to the rawinsonde vertical temperature data. Although there are differences, the vertical temperature profile from the RUC analysis compares reasonably well with the observed upper air soundings and rawinsonde data. Other analyses, such as the consideration of the vertical temperature profiles from within and outside of the domain, confirm that the strong, persistent temperature inversions and very shallow mixing heights are generally confined to the UGRB during this period.
Figure 10. Plot Of The Vertical Temperature Profile For Both The Sonde And The Nearest RUC Model Grid Point On February 20, 2008:
Based on the above findings, the RUC temperature data was used as the primary temperature data source for the entire CALMET domain (ITPROG=2). By driving the analysis with RUC temperature data, representative, spatially and temporally refined temperature fields are used for important stability calculations rather than quasi-periodic sonde data, or relying on more distant and less representative data such as the soundings at Riverton, WY.
CONCLUSIONS
The winter ozone events in the UGRB occur during periods of complex meteorology in an area of complex terrain. The CALMET diagnostic model is well-suited for this application since it can provide a fine-scale horizontal and vertical resolution of the area while integrating all available meteorological data obtained during the 2008 UGWOS field study and associated IOPs. The high resolution in the horizontal allows refined treatment of land cover and snow cover data, which are important to boundary layer stability and growth. The high resolution in the vertical allows for generating refined CALMET-predicted mixing heights and temperature inversions, both of which are considered important meteorological components of winter ozone formation in the UGRB.
Data which could not be, or was not used directly by CALMET was employed to verify CALMET and RUC model performance. The use of SODAR-derived mixing heights highlighted the importance of snow cover on the energy budget within the UGRB. If default values were used for land cover, the mixing heights would have been consistently biased high during the day. The inclusion of snow cover provides the CALMET model with a more realistic energy budget consistent with the actual conditions. Similarly, the good agreement between the sonde and RUC vertical temperature data demonstrates the value of using high quality high resolution prognostic data as the primary data set to initialize the 3-D wind and 2-D temperature fields, which allows for a better characterization of the wind and temperature fields on a spatial and temporal basis. These two factors, directly attributable to the model validation effort, increased the confidence of the analyses, results, and decisions made thereupon.
The results of these CALMET simulations show that with suitable observational data and mesoscale numerical weather prediction model data, the CALMET model provides a very viable and efficient approach that can yield a realistic representation of three-dimensional meteorological fields important for air quality modeling. These CALMET simulations provided a more refined and improved representation of meteorological conditions essential for air quality modeling that could not be achieved using observations or mesocale modeling alone. This is largely due to the capability of CALMET to directly incorporate meteorological and geophysical observations (i.e. snow data) and couple these data with gridded prognostic data. The model also has the ability to efficiently diagnose kinematic effects and terrain-adjusted flows that are important in valley areas such as the UGRB.
This study shows that the CALMET model configuration should be based on the following considerations:
- detailed quality assessment of the meteorological observations,
- detailed quality assessment of the mesoscale model gridded data,
- comparisons of mesoscale model gridded data with available observations, and
- the consideration of terrain and land use characteristics of the modeling domain.
Accurate diagnostic modeling requires a careful analysis of both observational data and gridded prognostic data to understand fully both the data quality and relationship between these data sources. This information, coupled with an understanding of the terrain and land use characteristics of the region and their affect on air quality, is important when selecting the various CALMET model switch settings that control the simulation (e.g. radius of influence settings or use of observations versus prognostic data).
Additional QA procedures to evaluate the full CALMET simulations, such as the automation of PRTMET to review various meteorological data, and the statistical procedures employed in the CALMET wind field validation add to the confidence and the overall veracity of the results.
REFERENCES
| [1] | WYDEQ-AQD. (March 2009). Technical Support Document I for Recommended 8-Hour Ozone Designation for the Upper Green River Basin, WY. Cheyenne: State of Wyoming. |
| [2] | ENVIRON, T&B Systems Inc., Meteorological Solutions Incorporated. (2008). Final Report 2008 Upper Green River Winter Ozone Study. |
| [3] | TRC. (May 2009). Upper Green River Winter Ozone Study: CALMET Database Development Phase I. Windsor: TRC. |
| [4] | Earth Tech. (2000). A User’s Guide for the CALMET Meteorological Model. |
KEYWORDS
CALMET, Wyoming, validation, ozone, mixing heights
AUTHORS
Ken Rairigh1, P.E.; Jason F. Reed2; Alfred M. Klausmann3, CCM; Michael B. Newman2, P.E.; Joseph S. Scire3, CCM; Gale F. Hoffnagle2,CCM, QEP
- The Wyoming Department of Environmental Quality – Air Quality Division, Herschler Building, 122 West 25th Street, Cheyenne, WY 82002
- TRC Environmental Corp., 21 Griffin Road North, Windsor, CT, 06095
- TRC Environmental Corp., 650 Suffolk St. #200, Lowell, MA, 01854
PUBLISHER NOTES
Paper originally published October 26, 2009 as Paper 47 for the meeting of the Air and Waste Management Association: Guideline on Air Quality Models: Next Generation of Models, Raleigh, North Carolina.